
Transformez les donnees en intelligence de securite exploitable, vous aidant a prevenir les incidents et a demontrer un retour mesurable de votre investissement en securite.
Transformez les données en intelligence de sécurité exploitable, pour vous aider à prévenir les incidents et à démontrer un retour mesurable sur votre investissement en sécurité.
Demander une demoVoyez exactement ou les evenements de proximite sont concentres dans tout votre site. Les cartes thermiques reveulent les zones a haut risque, les goulots d'etranglement et les zones de conflit de trafic. Utilisez ces informations pour redesigner les itineraires de trafic, ajouter des barrieres ou ajuster les limites de vitesse.
Suivez la facon dont les evenements de proximite changent au fil du temps. Les quasi-accidents augmentent-ils a un quart particulier ? Une nouvelle disposition du trafic a-t-elle reduit les evenements dans une zone mais cree un point chaud dans une autre ? Mesurez l'impact des interventions de securite avec des donnees.
Definissez des limites virtuelles et recevez des alertes instantanees lorsque des vehicules ou du personnel les franchissent. Renforcez les zones interdites en temps reel.
Voyez quelles machines sont actives, inactives ou hors service. Optimisez l'allocation de flotte et justifiez l'investissement en equipement.
Exportez les donnees pour les audits de securite, les presentations reglementaires et les rapports au niveau de la direction. Des options API, Power BI et CSV sont disponibles.
Identifiez les schemas de risque, mesurez l'efficacite des interventions et constituez des preuves pour les dossiers de securite.
Optimisez l'utilisation de la flotte et le flux de trafic du site en fonction de donnees reelles plutot que de suppositions.
Generez des rapports prets pour audit et demonstrez la conformite du devoir de vigilance avec des donnees probantes.
Demandez une demo en direct et decouvrez comment la Plateforme Insights peut transformer vos donnees d'avertisseur de proximite en ameliorations de securite mesurables dans toute votre operation.
La Plateforme Insights est disponible dans le cadre du paquet du systeme SensorZone. Contactez notre equipe pour plus de details sur les niveaux d'acces a la plateforme et les fonctionnalites incluses dans votre configuration materielle.
Les systemes SensorZone transmettent les donnees d'evenements via la connectivite cellulaire (4G/LTE) ou Wi-Fi lorsqu'elle est disponible. Si la connectivite est temporairement indisponible, les donnees sont stockees localement sur l'unite du vehicule et telechargees automatiquement lorsqu'une connexion est retablie.
Oui. La Plateforme Insights fournit une API REST pour l'integration avec les plates-formes HSEQ tierces, les outils de business intelligence comme Power BI et les applications personnalisees. L'export CSV est egalement disponible pour l'importation manuelle dans n'importe quel systeme.
Intelligence alimentee par l'IA
La Plateforme Insights ne montre pas seulement les donnees — elle les analyse. Alimentee par l'IA, elle identifie les schemas dans toute votre operation, signale les risques emergents avant qu'ils ne deviennent des incidents, et vous dit exactement ou vous concentrer.
Analyse des donnees de securite alimentee par l'IA qui fait ressortir les connaissances qui comptent le plus
Recommandations intelligentes sur les interventions de securite a privilegier sur tous vos sites
Assistant d'IA en langage naturel — generez des rapports avances en posant simplement une question en francais
Remplacer par une capture d'écran de la plateforme montrant les recommandations IA et les scores de sécurité
Cartographie visuelle de la securite
Transformez les donnees brutes de proximite en cartes visuelles qui revelent instantanement ou se trouve le danger. Les cartes thermiques montrent exactement quelles zones de votre site ont la plus forte concentration d'evenements de quasi-accident, tandis que les cartes d'evenements tracent chaque incursion de balise et detection de camera en temps reel.
Cartes thermiques du site qui mettent en evidence les zones a haut risque en un coup d'oeil — codees par couleur selon la gravite
Carte d'evenements montrant chaque incursion de balise et detection de camera tracee par emplacement et heure
Filtrez par plage de dates, vehicule, zone ou type de detection pour enqueter sur des schemas specifiques
🗺️ Capture d'écran de la carte thermique. Remplacer par une capture d'écran de la plateforme montrant la carte thermique du site avec les zones d'incursion en code couleur
Intelligence video
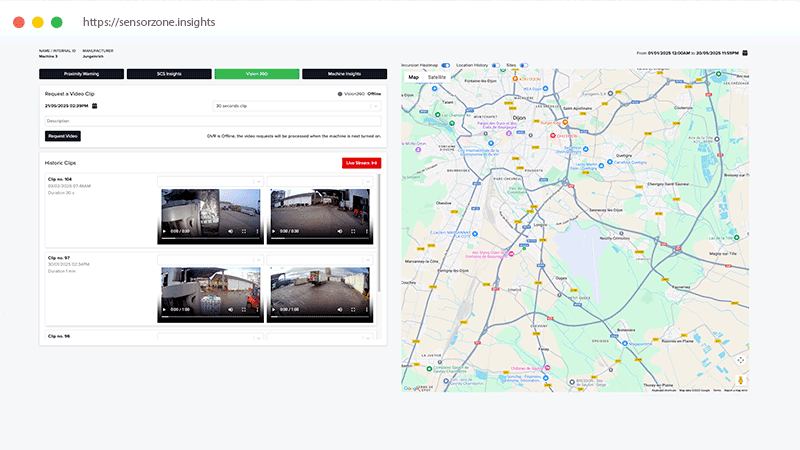
Allez au-dela des points de donnees. La Plateforme Insights s'integre directement aux cameras Vision360 et Proximity Warning Plus pour vous donner un acces instantane aux preuves video. Lorsqu'une incursion basee sur une balise est declenchee, le systeme marque automatiquement le metrage — pour que vous puissiez examiner le moment exact sans faire defiler des heures d'enregistrement.
Clips video a la demande — telechargez le metrage de n'importe quelle camera sur n'importe quel vehicule, n'importe quand
Diffusion en direct depuis les cameras Vision360 directement dans le tableau de bord de la Plateforme Insights
Correlation balise-video — liez automatiquement les incursions basees sur les balises au clip video correspondant pour un contexte complet de l'incident
🎥 Capture d'écran du lecteur vidéo. Remplacer par une capture d'écran de la plateforme montrant le flux en direct de la caméra ou l'interface de lecture de clips
Securite des travailleurs et coaching
Tous les risques ne sont pas egaux. La Plateforme Insights utilise une analyse de graphique de dispersion pour decouvrir les travailleurs a haut risque tot, avant que les schemas ne s'escaladent en incidents. Combinez cela avec des recommandations de coaching automatisees hebdomadairement et une analyse au niveau de l'equipe pour construire une culture de securite proactive qui combat la derive comportementale.
Graphiques de dispersion qui decouvrent les travailleurs a haut risque tot en tracant la frequence d'incursion par rapport a la gravite
Plans de coaching generes par IA hebdomadairement avec des recommandations specifiques pour chaque individu a haut risque
Combattez la derive comportementale avec le suivi des tendances et l'analyse des equipes de travail au fil du temps
📈 Capture d'écran du graphique en nuages de points. Remplacer par une capture d'écran de la plateforme montrant le nuage de points du risque des travailleurs avec les personnes à haut risque mises en évidence
Flotte et operations
Surveillez chaque machine de votre operation depuis un seul tableau de bord. Suivez les temps d'execution, les decomptes d'incursion et la conformite des tests de balise sur toute votre flotte. Le moteur de rapports avance vous permet de generer n'importe quel rapport dont vous avez besoin — ou simplement de poser une question a l'assistant IA en langage naturel.
Statistiques de temps d'execution et d'incursion de machine — savez quelles machines sont les plus actives et les plus a risque
Analyse des tests de balise pour verifier la sante du systeme et s'assurer que la balise de chaque travailleur fonctionne correctement
Rapports avances avec export CSV, integration Power BI et acces API pour les flux de travail automatises
🚜 Capture d'écran du tableau de bord de flotte. Remplacer par une capture d'écran de la plateforme montrant les statistiques de temps de fonctionnement des machines, le nombre d'incursions et les résultats des tests d'étiquettes
La Plateforme Insights supporte les interfaces multilingues pour que chaque membre de votre equipe puisse acceder aux donnees de securite dans sa propre langue. Actuellement disponible en anglais, espagnol, francais, polonais et roumain — avec d'autres langues etant ajoutees regulierement.
Support complet en espagnol sur tous les tableaux de bord, rapports et alertes.
Support complet en francais sur tous les tableaux de bord, rapports et alertes.
Support complet en polonais sur tous les tableaux de bord, rapports et alertes.
Support complet en roumain sur tous les tableaux de bord, rapports et alertes.