
Transforma datos en inteligencia de seguridad accionable, ayudandote a prevenir incidentes y demostrar un retorno medible de tu inversion en seguridad.
Transforme los datos en inteligencia de seguridad práctica, lo que le ayuda a prevenir incidentes y demostrar un retorno medible de su inversión en seguridad.
Solicitar una demostracionVe exactamente donde se concentran los eventos de proximidad en todo tu sitio. Los mapas termicos revelan zonas de alto riesgo, puntos criticos y areas de conflicto de trafico. Utiliza esta informacion para redisenar rutas de trafico, agregar barreras o ajustar limites de velocidad.
Rastreea como cambian los eventos de proximidad a lo largo del tiempo. Aumentan los casi choques en un turno particular? Ha reducido un nuevo diseño de trafico eventos en un area pero ha creado un punto caliente en otra? Mide el impacto de intervenciones de seguridad con datos.
Define limites virtuales y recibe alertas instantaneas cuando vehiculos o personal los violen. Refuerza zonas prohibidas en tiempo real.
Ve que maquinas estan activas, inactivas o fuera de servicio. Optimiza la asignacion de flota y justifica la inversion en equipos.
Exporta datos para auditorias de seguridad, presentaciones regulatorias e informes a nivel directivo. Hay opciones de API, Power BI y CSV disponibles.
Identifica patrones de riesgo, mide la efectividad de las intervenciones y construye evidencia para casos de seguridad.
Optimiza la utilizacion de flota y el flujo de trafico del sitio basado en datos reales en lugar de suposiciones.
Genera informes listos para auditorias y demuestra cumplimiento de deber de cuidado con datos basados en evidencia.
Solicita una demostracion en vivo y descubre como la Plataforma Insights puede convertir tus datos de advertencia de proximidad en mejoras de seguridad medibles en toda tu operacion.
La Plataforma Insights esta disponible como parte del paquete del sistema SensorZone. Contacta a nuestro equipo para detalles sobre los niveles de acceso a plataforma y caracteristicas incluidas con tu configuracion de hardware.
Los sistemas SensorZone transmiten datos de eventos via conectividad celular (4G/LTE) o Wi-Fi cuando esta disponible. Si la conectividad es temporalmente indisponible, los datos se almacenan localmente en la unidad del vehiculo y se cargan automaticamente cuando se restaura una conexion.
Si. La Plataforma Insights proporciona una API REST para integracion con plataformas HSEQ de terceros, herramientas de inteligencia de negocios como Power BI y aplicaciones personalizadas. La exportacion de CSV tambien esta disponible para importacion manual a cualquier sistema.
Inteligencia impulsada por IA
La Plataforma Insights no solo te muestra datos — los analiza. Impulsada por IA, identifica patrones en toda tu operacion, senala riesgos emergentes antes de que se conviertan en incidentes, y te dice exactamente donde enfocarse.
Analisis de datos de seguridad impulsado por IA que destaca los conocimientos que mas importan
Recomendaciones inteligentes sobre donde enfocarse en intervenciones de seguridad en todos tus sitios
Asistente de IA en lenguaje natural — genera informes avanzados simplemente haciendo una pregunta en espanol
Sustituir por una captura de pantalla de la plataforma que muestre las recomendaciones de IA y las puntuaciones de seguridad
Mapeo visual de seguridad
Transforma datos brutos de proximidad en mapas visuales que revelan instantaneamente donde esta el peligro. Los mapas termicos muestran exactamente que areas de tu sitio tienen la mayor concentracion de eventos de casi choque, mientras que los mapas de eventos trazan cada incursion de etiqueta y deteccion de camara en tiempo real.
Mapas termicos del sitio que destacan zonas de alto riesgo de un vistazo — codificadas por color segun la gravedad
Mapa de eventos que muestra cada incursion de etiqueta y deteccion de camara trazada por ubicacion y hora
Filtra por rango de fechas, vehiculo, zona o tipo de deteccion para investigar patrones especificos
🗺️ Captura de pantalla del mapa de calor. Sustituir por una captura de pantalla de la plataforma que muestre el mapa de calor del centro con zonas de incursión con código de colores
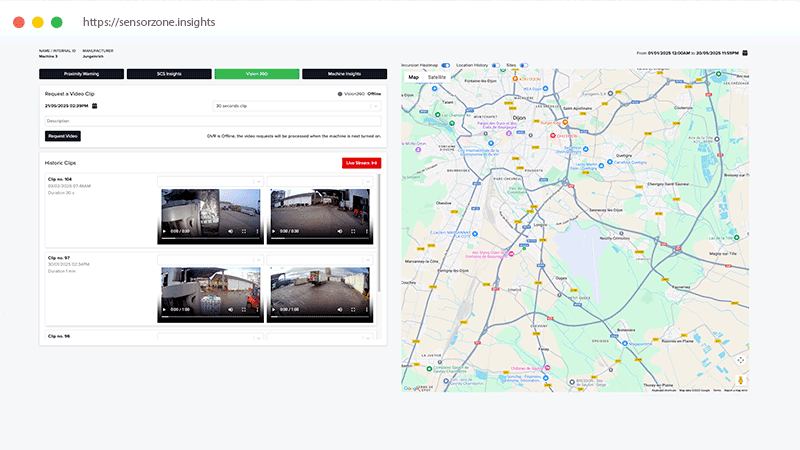
Inteligencia de video
Ve mas alla de los puntos de datos. La Plataforma Insights se integra directamente con camaras Vision360 y Proximity Warning Plus para darte acceso instantaneo a evidencia de video. Cuando se dispara una incursion basada en etiqueta, el sistema marca automaticamente el metraje — para que puedas revisar el momento exacto sin desplazarte por horas de grabaciones.
Clips de video bajo demanda — descarga metraje de cualquier camara en cualquier vehiculo, en cualquier momento
Transmision en vivo desde camaras Vision360 directamente dentro del panel de control de la Plataforma Insights
Correlacion de etiqueta y video — vincula automaticamente incursiones basadas en etiqueta con el clip de video coincidente para contexto completo del incidente
🎥 Captura de pantalla del reproductor de video. Sustituir por una captura de pantalla de la plataforma que muestre la transmisión en vivo de la cámara o la interfaz de reproducción de clips
Seguridad de trabajadores y coaching
No todos los riesgos son iguales. La Plataforma Insights usa analisis de graficos de dispersion para detectar trabajadores de alto riesgo temprano, antes de que los patrones se intensifiquen en incidentes. Combina esto con recomendaciones de coaching automatizadas semanalmente y analisis a nivel de turno para construir una cultura de seguridad proactiva que combata la deriva de comportamiento.
Graficos de dispersion que detectan trabajadores de alto riesgo temprano trazando frecuencia de incursion contra gravedad
Planes de coaching generados por IA semanalmente con recomendaciones especificas para cada individuo de alto riesgo
Combate la deriva de comportamiento con seguimiento de tendencias y analisis de turno del trabajador a lo largo del tiempo
📈 Captura de pantalla del diagrama de dispersión. Sustituir por una captura de pantalla de la plataforma que muestre el diagrama de dispersión del riesgo de los trabajadores con las personas de alto riesgo destacadas
Flota y operaciones
Monitorea cada maquina en tu operacion desde un solo panel de control. Rastreea tiempos de ejecucion, conteos de incursion y cumplimiento de prueba de etiqueta en toda tu flota. El motor de informes avanzado te permite generar cualquier informe que necesites — o simplemente pide al asistente de IA en lenguaje natural.
Estadisticas de tiempo de ejecucion y incursion de maquina — sabe cuales vehiculos estan mas activos y mas en riesgo
Analisis de prueba de etiqueta para verificar la salud del sistema y garantizar que la etiqueta de cada trabajador funcione correctamente
Informes avanzados con exportacion a CSV, integracion de Power BI y acceso API para flujos de trabajo automatizados
🚜 Captura de pantalla del panel de flota. Sustituir por una captura de pantalla de la plataforma que muestre las estadísticas de tiempo de actividad de las máquinas, los recuentos de incursiones y los resultados de las pruebas de etiqueta
La Plataforma Insights soporta interfaces multilingues para que cada miembro de tu equipo pueda acceder a datos de seguridad en su propio idioma. Actualmente disponible en ingles, espanol, frances, polaco y rumano — con mas idiomas siendo agregados regularmente.
Soporte completo en idioma espanol en todos los paneles de control, informes y alertas.
Soporte completo en idioma frances en todos los paneles de control, informes y alertas.
Soporte completo en idioma polaco en todos los paneles de control, informes y alertas.
Soporte completo en idioma rumano en todos los paneles de control, informes y alertas.